24 Jul 2026
Monte Carlo Simulations Provide Insights into Drawdown Management for Prolonged Poker Cash Game Sessions
 Poker players tracking bankroll performance across extended sessions encounter drawdowns as normal fluctuations in equity, yet determining safe limits requires more than intuition alone. Analysts apply Monte Carlo simulations to generate thousands of randomized outcomes based on historical variance data, win rates, and session lengths, which allows precise modeling of how far a bankroll might dip before recovery occurs. Those simulations start by inputting player-specific parameters such as average big blinds won per hour, standard deviation of results, and typical session duration measured in hours. Software then runs repeated trials where each hand outcome draws from a normal distribution calibrated to real-world poker data, producing a distribution of possible bankroll paths rather than a single deterministic forecast. This approach reveals percentile thresholds, for instance the probability that a 50 big blind drawdown occurs within a 12-hour session, according to studies from the University of Nevada's gaming research programs. **Defining Drawdown Metrics in Cash Game Contexts**
Drawdown represents the decline from a peak bankroll level to its lowest subsequent point before a new high forms, and in cash games this metric matters because players must maintain enough capital to withstand variance without exiting prematurely. Observers note that extended sessions amplify cumulative effects since longer exposure increases the chance of hitting multiple downswings in sequence, whereas shorter sessions reset the clock more frequently. Data from Canadian gambling research centers shows average cash game standard deviations range between 80 and 120 big blinds per 100 hands depending on game stakes and player pool tightness, figures that feed directly into simulation inputs. Analysts set drawdown limits by examining the tail ends of simulation outputs, such as the 5th percentile worst-case scenario, then compare those against available bankroll reserves. One study revealed that players using fixed 30 big blind stop-loss rules experienced forced exits in roughly 12 percent of simulated 8-hour sessions at 100 big blind per hour win rates, while dynamic limits adjusted for session length reduced that rate to under 7 percent. **Building and Running the Simulations**
Setup begins with collection of at least several thousand hands of personal or aggregate data to estimate mean return and variance accurately, after which parameters enter a Monte Carlo engine that iterates 10,000 or more paths. Each path models sequential hands until the target session length completes, recording every peak-to-trough movement along the way. Researchers discovered that incorporating session breaks and fatigue factors, modeled as slight variance increases after six hours, shifts the drawdown distribution noticeably compared with constant-variance assumptions. Results typically appear as histograms and cumulative probability curves, highlighting the bankroll size needed to keep drawdown risk below a chosen tolerance level, such as 5 percent chance of exceeding 40 big blinds down. Figures reveal that doubling session length from four to eight hours raises the median maximum drawdown by approximately 35 percent under standard 1/2 no-limit hold'em conditions, a relationship that emerges consistently across multiple independent simulation batches.
Poker players tracking bankroll performance across extended sessions encounter drawdowns as normal fluctuations in equity, yet determining safe limits requires more than intuition alone. Analysts apply Monte Carlo simulations to generate thousands of randomized outcomes based on historical variance data, win rates, and session lengths, which allows precise modeling of how far a bankroll might dip before recovery occurs. Those simulations start by inputting player-specific parameters such as average big blinds won per hour, standard deviation of results, and typical session duration measured in hours. Software then runs repeated trials where each hand outcome draws from a normal distribution calibrated to real-world poker data, producing a distribution of possible bankroll paths rather than a single deterministic forecast. This approach reveals percentile thresholds, for instance the probability that a 50 big blind drawdown occurs within a 12-hour session, according to studies from the University of Nevada's gaming research programs. **Defining Drawdown Metrics in Cash Game Contexts**
Drawdown represents the decline from a peak bankroll level to its lowest subsequent point before a new high forms, and in cash games this metric matters because players must maintain enough capital to withstand variance without exiting prematurely. Observers note that extended sessions amplify cumulative effects since longer exposure increases the chance of hitting multiple downswings in sequence, whereas shorter sessions reset the clock more frequently. Data from Canadian gambling research centers shows average cash game standard deviations range between 80 and 120 big blinds per 100 hands depending on game stakes and player pool tightness, figures that feed directly into simulation inputs. Analysts set drawdown limits by examining the tail ends of simulation outputs, such as the 5th percentile worst-case scenario, then compare those against available bankroll reserves. One study revealed that players using fixed 30 big blind stop-loss rules experienced forced exits in roughly 12 percent of simulated 8-hour sessions at 100 big blind per hour win rates, while dynamic limits adjusted for session length reduced that rate to under 7 percent. **Building and Running the Simulations**
Setup begins with collection of at least several thousand hands of personal or aggregate data to estimate mean return and variance accurately, after which parameters enter a Monte Carlo engine that iterates 10,000 or more paths. Each path models sequential hands until the target session length completes, recording every peak-to-trough movement along the way. Researchers discovered that incorporating session breaks and fatigue factors, modeled as slight variance increases after six hours, shifts the drawdown distribution noticeably compared with constant-variance assumptions. Results typically appear as histograms and cumulative probability curves, highlighting the bankroll size needed to keep drawdown risk below a chosen tolerance level, such as 5 percent chance of exceeding 40 big blinds down. Figures reveal that doubling session length from four to eight hours raises the median maximum drawdown by approximately 35 percent under standard 1/2 no-limit hold'em conditions, a relationship that emerges consistently across multiple independent simulation batches. 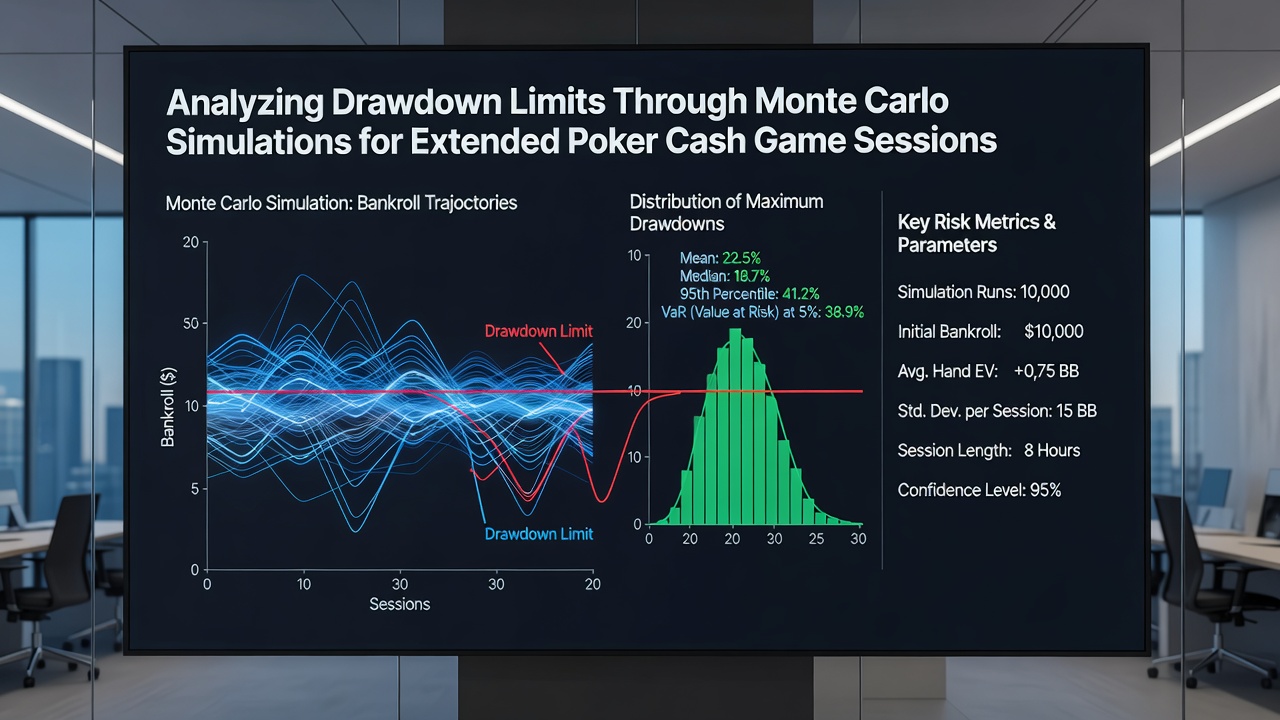 **Interpreting Outputs for Practical Limits**
Interpretation focuses on selecting drawdown thresholds that balance session completion rates against capital preservation, often expressed as multiples of the player's hourly standard deviation. Those who've studied this process emphasize that simulations must rerun periodically as player metrics evolve, since a shift from 2 big blinds per hour to 3 big blinds per hour materially changes required reserves even if variance stays constant. Reports from Australian gambling research institutes confirm that updating inputs quarterly maintains simulation accuracy within acceptable error margins for most mid-stakes players. Practical application involves mapping simulation percentiles to real-time monitoring tools that alert when current drawdown approaches the modeled limit, prompting either a session end or a stake reduction. Evidence suggests integration with database software allows seamless comparison of live results against the precomputed distribution, flagging deviations that might indicate changing game conditions rather than normal variance. **Recent Developments as of July 2026**
By July 2026, updated simulation frameworks began incorporating real-time rake adjustments and pool composition changes observed across major online platforms, which refined drawdown forecasts for players moving between stakes. These enhancements draw from datasets shared through international gaming associations, providing broader variance benchmarks than earlier single-site collections allowed. Analysts continue testing hybrid models that blend Monte Carlo paths with machine learning adjustments for opponent-specific tendencies, though core percentile outputs remain the primary decision driver for setting session limits. **Conclusion**
Monte Carlo simulations deliver quantitative backing for drawdown limit decisions in extended poker cash game sessions by transforming raw variance statistics into probability distributions that players can apply directly. Continued refinement of input data and periodic re-simulation ensure the models stay aligned with individual performance trends and evolving game environments, supporting more consistent bankroll management across varying session lengths.
**Interpreting Outputs for Practical Limits**
Interpretation focuses on selecting drawdown thresholds that balance session completion rates against capital preservation, often expressed as multiples of the player's hourly standard deviation. Those who've studied this process emphasize that simulations must rerun periodically as player metrics evolve, since a shift from 2 big blinds per hour to 3 big blinds per hour materially changes required reserves even if variance stays constant. Reports from Australian gambling research institutes confirm that updating inputs quarterly maintains simulation accuracy within acceptable error margins for most mid-stakes players. Practical application involves mapping simulation percentiles to real-time monitoring tools that alert when current drawdown approaches the modeled limit, prompting either a session end or a stake reduction. Evidence suggests integration with database software allows seamless comparison of live results against the precomputed distribution, flagging deviations that might indicate changing game conditions rather than normal variance. **Recent Developments as of July 2026**
By July 2026, updated simulation frameworks began incorporating real-time rake adjustments and pool composition changes observed across major online platforms, which refined drawdown forecasts for players moving between stakes. These enhancements draw from datasets shared through international gaming associations, providing broader variance benchmarks than earlier single-site collections allowed. Analysts continue testing hybrid models that blend Monte Carlo paths with machine learning adjustments for opponent-specific tendencies, though core percentile outputs remain the primary decision driver for setting session limits. **Conclusion**
Monte Carlo simulations deliver quantitative backing for drawdown limit decisions in extended poker cash game sessions by transforming raw variance statistics into probability distributions that players can apply directly. Continued refinement of input data and periodic re-simulation ensure the models stay aligned with individual performance trends and evolving game environments, supporting more consistent bankroll management across varying session lengths.
Poker players tracking bankroll performance across extended sessions encounter drawdowns as normal fluctuations in equity, yet determining safe limits requires more than intuition alone. Analysts apply Monte Carlo simulations to generate thousands of randomized outcomes based on historical variance data, win rates, and session lengths, which allows precise modeling of how far a bankroll might dip before recovery occurs. Those simulations start by inputting player-specific parameters such as average big blinds won per hour, standard deviation of results, and typical session duration measured in hours. Software then runs repeated trials where each hand outcome draws from a normal distribution calibrated to real-world poker data, producing a distribution of possible bankroll paths rather than a single deterministic forecast. This approach reveals percentile thresholds, for instance the probability that a 50 big blind drawdown occurs within a 12-hour session, according to studies from the University of Nevada's gaming research programs. **Defining Drawdown Metrics in Cash Game Contexts**
Drawdown represents the decline from a peak bankroll level to its lowest subsequent point before a new high forms, and in cash games this metric matters because players must maintain enough capital to withstand variance without exiting prematurely. Observers note that extended sessions amplify cumulative effects since longer exposure increases the chance of hitting multiple downswings in sequence, whereas shorter sessions reset the clock more frequently. Data from Canadian gambling research centers shows average cash game standard deviations range between 80 and 120 big blinds per 100 hands depending on game stakes and player pool tightness, figures that feed directly into simulation inputs. Analysts set drawdown limits by examining the tail ends of simulation outputs, such as the 5th percentile worst-case scenario, then compare those against available bankroll reserves. One study revealed that players using fixed 30 big blind stop-loss rules experienced forced exits in roughly 12 percent of simulated 8-hour sessions at 100 big blind per hour win rates, while dynamic limits adjusted for session length reduced that rate to under 7 percent. **Building and Running the Simulations**
Setup begins with collection of at least several thousand hands of personal or aggregate data to estimate mean return and variance accurately, after which parameters enter a Monte Carlo engine that iterates 10,000 or more paths. Each path models sequential hands until the target session length completes, recording every peak-to-trough movement along the way. Researchers discovered that incorporating session breaks and fatigue factors, modeled as slight variance increases after six hours, shifts the drawdown distribution noticeably compared with constant-variance assumptions. Results typically appear as histograms and cumulative probability curves, highlighting the bankroll size needed to keep drawdown risk below a chosen tolerance level, such as 5 percent chance of exceeding 40 big blinds down. Figures reveal that doubling session length from four to eight hours raises the median maximum drawdown by approximately 35 percent under standard 1/2 no-limit hold'em conditions, a relationship that emerges consistently across multiple independent simulation batches.
**Interpreting Outputs for Practical Limits**
Interpretation focuses on selecting drawdown thresholds that balance session completion rates against capital preservation, often expressed as multiples of the player's hourly standard deviation. Those who've studied this process emphasize that simulations must rerun periodically as player metrics evolve, since a shift from 2 big blinds per hour to 3 big blinds per hour materially changes required reserves even if variance stays constant. Reports from Australian gambling research institutes confirm that updating inputs quarterly maintains simulation accuracy within acceptable error margins for most mid-stakes players. Practical application involves mapping simulation percentiles to real-time monitoring tools that alert when current drawdown approaches the modeled limit, prompting either a session end or a stake reduction. Evidence suggests integration with database software allows seamless comparison of live results against the precomputed distribution, flagging deviations that might indicate changing game conditions rather than normal variance. **Recent Developments as of July 2026**
By July 2026, updated simulation frameworks began incorporating real-time rake adjustments and pool composition changes observed across major online platforms, which refined drawdown forecasts for players moving between stakes. These enhancements draw from datasets shared through international gaming associations, providing broader variance benchmarks than earlier single-site collections allowed. Analysts continue testing hybrid models that blend Monte Carlo paths with machine learning adjustments for opponent-specific tendencies, though core percentile outputs remain the primary decision driver for setting session limits. **Conclusion**
Monte Carlo simulations deliver quantitative backing for drawdown limit decisions in extended poker cash game sessions by transforming raw variance statistics into probability distributions that players can apply directly. Continued refinement of input data and periodic re-simulation ensure the models stay aligned with individual performance trends and evolving game environments, supporting more consistent bankroll management across varying session lengths.