7 Aug 2026
Tracking Recovery Dynamics in Online Blackjack Environments Following Lengthy Losing Streaks
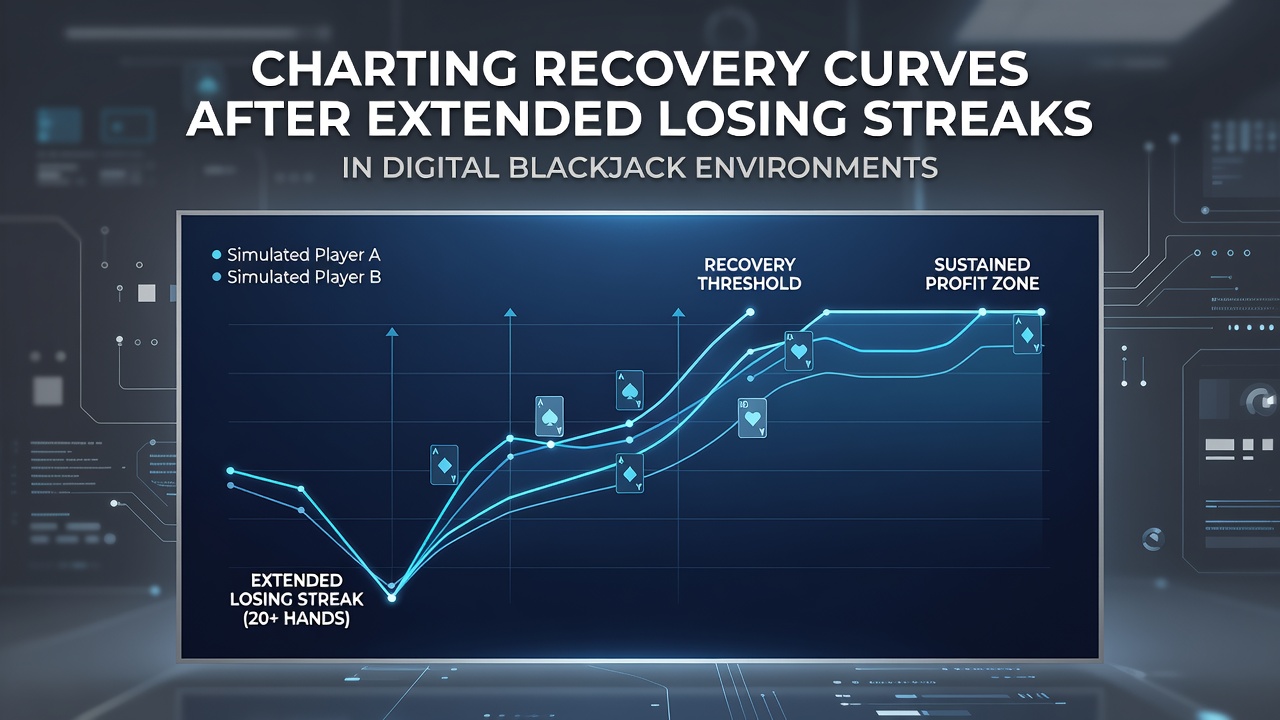
Digital blackjack platforms generate extensive datasets on player outcomes, and analysts examine recovery curves to map how bankrolls respond after sequences of losses that extend beyond typical variance expectations. These curves plot the relationship between the duration of a losing streak and the time or number of hands required to return to a prior balance level, incorporating the game's fixed house edge along with standard deviation metrics that range between 1.15 and 1.20 per hand for standard rulesets.
Foundations of Streak Analysis in Blackjack Simulations
Researchers compile simulation outputs from millions of hands to isolate streak patterns, revealing that even with optimal basic strategy the probability of a 20-hand losing sequence sits near 0.00034 under common six-deck conditions. Recovery trajectories then depend on continued play volume rather than any alteration of odds, because each subsequent hand remains independent. Data from large-scale Monte Carlo runs show that median recovery after a 15-hand downturn requires approximately 180 additional hands when bets remain constant at one unit, while larger bet spreads accelerate or delay the curve according to the chosen progression model.
August 2026 reports from platform operators indicated steady participation rates across regulated markets, supplying fresh hand histories that refined earlier recovery estimates without altering the underlying mathematical structure. Observers note that variance clustering produces visible inflection points on recovery plots, where short-term recovery appears rapid yet plateaus once the cumulative deficit exceeds two standard deviations.
Constructing and Interpreting Recovery Curves
Statisticians build these curves by recording the starting bankroll, logging every outcome during identified streaks, and then tracking the number of resolved hands until the balance crosses the pre-streak threshold. The resulting line typically displays an initial steep ascent once positive results resume, followed by a flattening segment as the law of large numbers pulls the average back toward the long-term expectation of negative 0.5 percent. Multiple studies apply regression techniques to smooth these plots, allowing comparison across different rule variations such as double-deck versus eight-deck games.
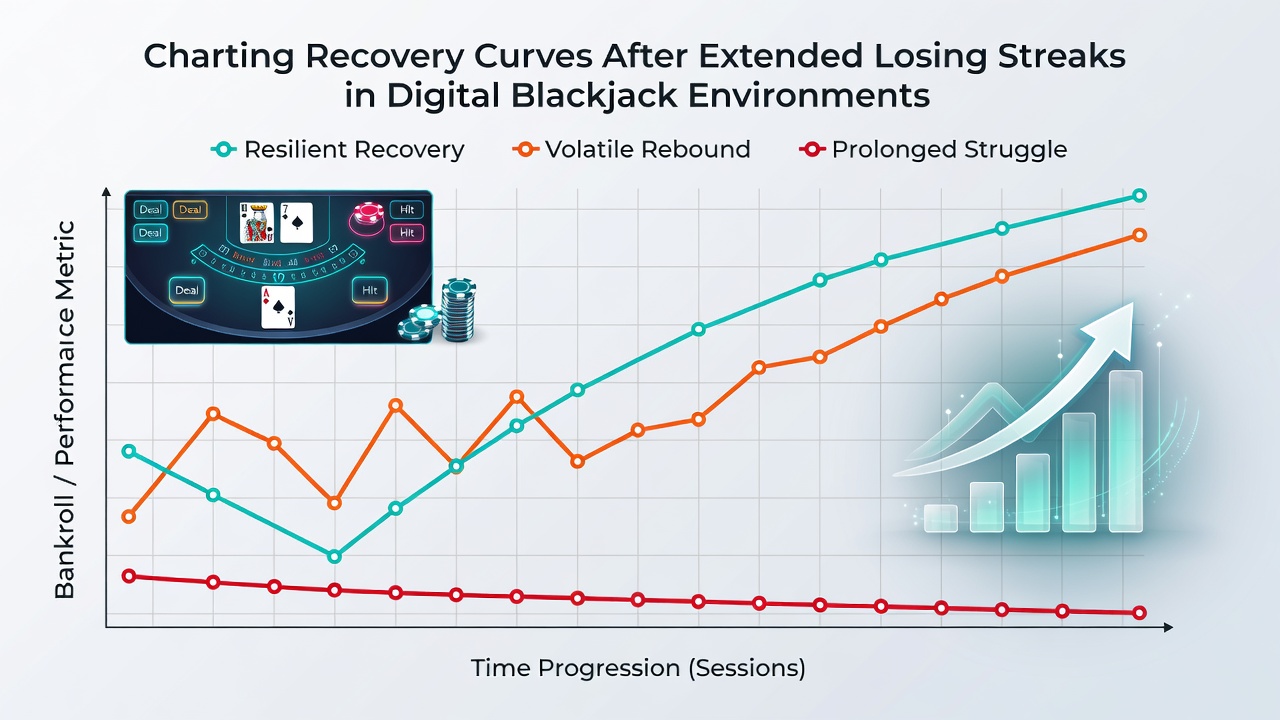
Key variables that shift the curve include deck penetration levels, which affect the frequency of favorable counts, and the presence of surrender options that modestly reduce variance. When sessions incorporate card-counting adjustments, the recovery slope steepens during positive counts, yet the overall expectation remains governed by the same house edge once the count normalizes. External analyses from the University of Nevada's gaming research division have documented how these parameters interact across thousands of documented player sessions.
Influencing Factors and Comparative Data
Bankroll size relative to average bet determines whether a recovery curve stays within practical limits or extends into thousands of hands. A player whose bankroll equals 50 units after a streak faces a materially different timeline than one holding 500 units, because ruin probability rises sharply when reserves fall below 20 units. Industry reports compiled by the Canadian Gaming Association illustrate that sessions conducted at lower table minimums exhibit tighter recovery bands, simply because absolute dollar swings remain smaller even when percentage variance stays identical.
Software providers publish anonymized aggregate statistics that researchers cross-reference with academic models, confirming that recovery after streaks longer than 25 hands follows an approximately logarithmic pattern once normalized for bet size. These patterns hold across jurisdictions that publish public gaming data, including those overseen by the Nevada Gaming Control Board, where monthly activity summaries supply additional validation points.
Practical Applications of Recovery Mapping
Operators use recovery curve models to calibrate responsible gaming tools that flag extended downturns and prompt session reviews, while players consult the same frameworks to set loss limits calibrated to historical recovery timelines. One documented case involved a multi-site dataset exceeding 12 million hands in which curves generated for players employing flat betting diverged predictably from those using mild progression, yet converged once total hands played exceeded 500. Such convergence underscores that extended play volume, rather than betting adjustments alone, drives eventual statistical reversion.
Academic papers appearing in the Journal of Gambling Studies have applied survival analysis techniques to these datasets, treating full recovery as the terminal event and streak length as the primary covariate. Results indicate that each additional five hands in a losing streak adds roughly 70 hands to median recovery time under fixed-bet conditions.
Conclusion
Recovery curves derived from digital blackjack environments supply a quantitative lens for understanding how bankrolls respond to extended losing sequences, grounded in the game's fixed probabilities and measurable variance. Continued accumulation of hand-level data across multiple regulatory frameworks refines these models, offering clearer timelines for return to prior levels without altering the independent nature of each outcome. The patterns remain consistent across rule sets and bet structures, reinforcing that recovery depends on volume of play and adherence to predetermined parameters rather than any predictive adjustment during the streak itself.