21 Jun 2026
Volatility Mapping in Gaming Verticals Provides Framework for Better Allocation Decisions
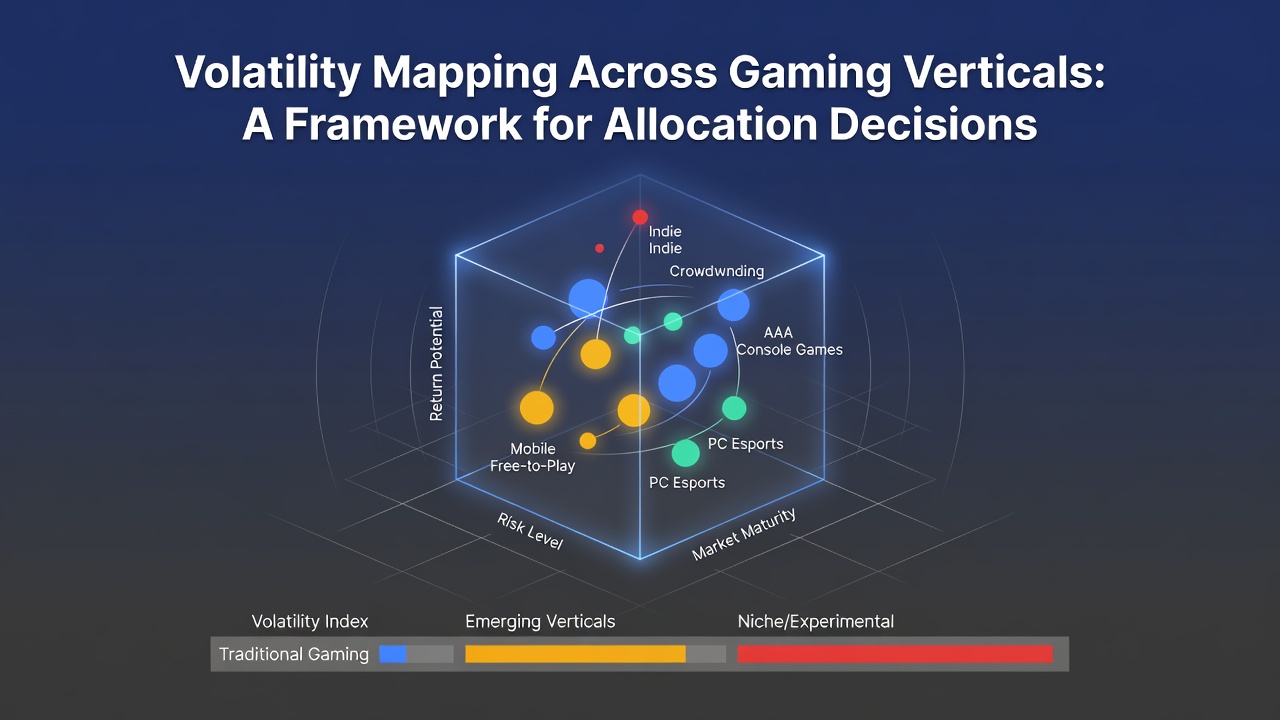
Volatility mapping serves as a structured approach that operators and analysts apply when evaluating risk profiles across distinct gaming verticals, and this method supports decisions on capital allocation by identifying patterns in outcome variability. Data from multiple markets show that verticals such as slot machines, table games, sports betting and lottery products exhibit measurable differences in standard deviation of returns, which in turn influence how resources get distributed between product development, marketing and compliance functions.
Defining Volatility Within Gaming Contexts
Researchers define volatility in gaming as the degree of fluctuation in player outcomes over repeated trials, and this measure differs substantially from one vertical to another because each operates under unique rules and payout structures. Studies from the American Gaming Association indicate that high-volatility games produce larger swings in individual session results while low-volatility options deliver steadier but smaller returns, and these distinctions become critical when organizations allocate budgets across portfolios. Observers note that mapping these patterns requires consistent data collection on metrics such as hit frequency, payout variance and session duration, which together create comparable indices across categories.
Key Components of a Volatility Mapping Framework
A practical framework begins with the collection of granular transaction data, followed by statistical normalization that allows direct comparison between verticals with different house edges and player volumes. Analysts typically calculate coefficients of variation for each product line, then plot these values against expected return metrics to generate visual matrices that highlight risk-return trade-offs. Figures from industry reports released in early 2026 reveal that operators who apply such matrices adjust marketing spend more rapidly when seasonal participation patterns shift, and this responsiveness correlates with steadier revenue trajectories across quarters.
Additional layers include segmentation by player cohort, because recreational users and high-volume participants experience volatility differently even within the same game type. Data indicates that mapping tools incorporating cohort-level variance produce allocation recommendations that reduce overexposure to single verticals during periods of regulatory change or market contraction.
Application Across Major Gaming Verticals
Slots consistently register among the highest volatility categories due to their wide payout distributions and infrequent large wins, whereas blackjack and other table games show lower variance when played under standard rules. Sports betting occupies an intermediate position because outcome volatility depends heavily on event frequency and the accuracy of odds-setting models, and research published by university-affiliated gambling studies centers demonstrates that live betting segments within sports can spike variance during high-stakes periods. Lottery products, by contrast, display extreme long-tail volatility driven by rare jackpot events, which creates distinct capital requirements for prize pools and reserve funds.

Those who have examined multi-vertical portfolios find that combining high-volatility and low-volatility offerings can stabilize overall cash flows, yet the optimal mix varies according to regulatory jurisdiction and available liquidity. In June 2026, several North American operators publicly referenced volatility-adjusted models when announcing shifts in capital toward digital table games and away from certain slot networks, citing improved risk balancing as the primary driver.
Integrating External Data Sources Into Allocation Models
Effective mapping incorporates regulatory filings, third-party audit reports and academic datasets to validate internal figures. Links to sources such as American Gaming Association publications and peer-reviewed papers from institutions like the University of Nevada provide standardized benchmarks that strengthen cross-market comparisons. Analysts cross-reference these external inputs with proprietary performance logs to refine volatility scores and test allocation scenarios under simulated stress conditions.
Implementation Considerations and Limitations
Successful deployment of volatility mapping depends on data quality and the frequency of updates, because stale inputs can distort risk assessments during rapid market movements. Organizations that maintain automated pipelines for real-time variance tracking report fewer instances of misallocated resources, and case examples from European operators illustrate how quarterly recalibration prevented overcommitment to emerging verticals with unproven volatility profiles. Limitations arise when sample sizes remain small or when regulatory restrictions limit data sharing across borders, yet frameworks that explicitly account for these constraints still deliver measurable improvements in allocation precision.
Conclusion
Volatility mapping supplies gaming organizations with a repeatable process for comparing risk characteristics across verticals and translating those comparisons into allocation choices. Evidence from regulatory filings, industry associations and academic analyses shows that structured application of these frameworks supports more consistent revenue management while accommodating the distinct statistical properties of slots, table games, sports betting and lottery products. As markets continue to evolve, ongoing refinement of mapping techniques remains a central element in strategic planning across the sector.